The aim of this project was to build an end-to-end Azure-based solution for predicting and monitoring air quality in Newcastle. This involved gathering PM2.5 data for Newcastle city centre and displaying this on a Power BI dashboard. Additionally, we trained a forecasting model to estimate the levels of PM2.5 for the next 14 days that could be used to identify risk to human health. Finally, the entire end-to-end workflow was automated to enable continuous updates.
Source data
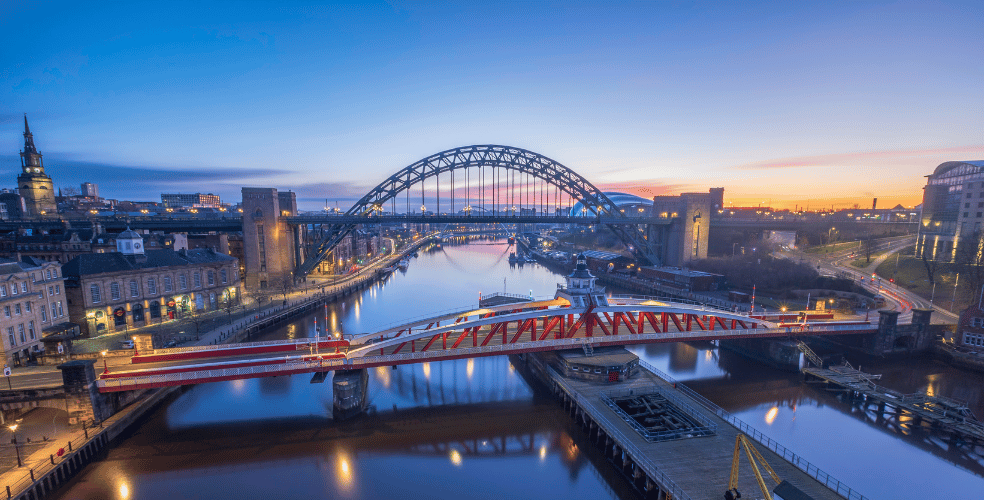
Newcastle University’s Urban Observatory is a smart city data monitoring system and has the largest deployment of sensors in the UK. These provide large quantities of open source real-time data on noise pollution, air quality, traffic flow, and various other metrics, available via APIs. We focused on PM2.5 - particles in the atmosphere with a diameter of 2.5 micrometres or less - that arise from sources such as combustion from transport and industrial / manufacturing processes. Many studies have shown that high levels of PM2.5 can have a harmful effect on people’s health and therefore emphasise the need to monitor and estimate levels.
Power BI dashboard
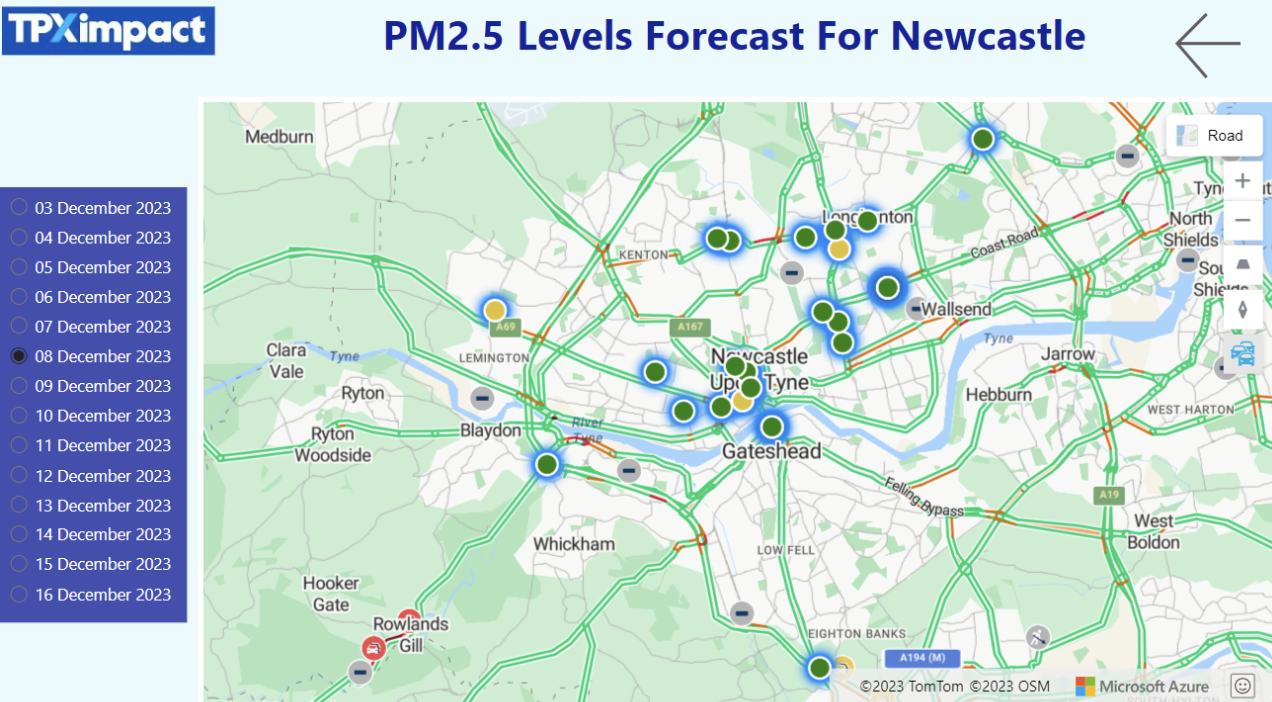
In this dashboard ranges are colour-coded into a simple traffic light scheme. Users can view charts of past PM2.5 levels and select a date up to 14 days from the current date to display the estimated PM2.5 levels across sensors in Newcastle city centre.
Data acquisition
Raw data from the APIs was downloaded for all available sensors across the city for the last 6 months. We had to perform a certain amount of data wrangling and transformation to deal with data quality issues. For example, we identified examples where the PM2.5 value was 0 or negative. In such cases, the values were replaced with the mean average of the sensor's data. The cleaned up data was stored for use in the Power BI dashboards and forecasting models.
Predicting air quality
One of the goals of this project was to train a statistical model to predict future levels of PM2.5. In this work, we used the popular Prophet open source toolkit from Meta. This can be used to fit non-linear trends in the data and capture temporal features, such as seasonality and holiday effects. Before forecasting, it is good practice to check that the time-series data is appropriate for modelling. We did this using autocorrelation to analyse the degree of similarity between a given time series and a lagged version of itself over successive time intervals. This outputs a score between 1 and -1, with a stronger correlation shown by a value closer to 1. Data unsuitable for time-series forecasting would have a value near 0; in our case, the value was close to 1 across all lagged points.
The Prophet model is based on an equation that expresses a dependent variable (such as our PM2.5 sensor readings) as the sum of non-linear independent variables (seasonality, trend, holidays, etc). By specifying a future time horizon, Prophet uses this equation to output estimated values - in our case predicted PM2.5 values for the next 14 days for a given sensor. Prophet is also capable of handling outliers and missing values, as well as automatically detecting changepoints (a point in the data where the underlying characteristics of the data change - such as trend, seasonality, and variance).
To train and test the forecasting model, we split the downloaded data for each sensor into 80% for training and 20% for testing. For time-series data, it is important to keep the time-ordering of the data points, so we split the data by taking the last 20% of the data as our test data. Prophet expects the input data to be formatted as a two column table, with x and y headings. The time column is set as x, ensuring the data is in the correct format (we used Pandas to_datetime method to ensure all the data was using the same date format), and the PM2.5 sensor readings were set as y. Prophet also allows us to adjust various hyperparameters that can help to improve the performance of the model (although at the same time can overfit a model affecting its ability to make predictions on new unseen cases). We tuned the hyperparameter using a grid search to test different combinations and select the best performing model. We used the mean absolute percentage error (MAPE) as the main metric we wanted to optimise for. Once we found the optimal hyperparameters, the models were retrained using all the data, and MAPE was recalculated for each sensor. The sensor models used in the Power BI report all had a MAPE of less than 20%, with most being less than 10%.
Automating the process
The final aspect of the project was automating the process and setting it to update the data and models daily (known as productionisation). We set up an Azure-based architecture using Azure Data Factory (ADF) to manage various pipelines to download data from the Newcastle Observatory on a daily basis, transform and clean the data and then merge this with previous downloads. We also used ADF to trigger an ADF pipeline in Azure Machine Learning (ML) Studio that would retrain the models, make predictions and send the outputs to an Azure data store (ADLS Gen 2 data lake). The ADF pipeline would also send alerts if any steps in the process failed. Each time the process would start, an additional day of data would be collected from Urban Observatory’s API. The dataset was not restricted to a specific fixed period, allowing for the models to be retrained on ever growing datasets, improving their performance. This was due to a limitation on how far back we could initially collect data from the API.
The pipeline in Azure ML was split into two blocks (components): a train component and a score component. Each component consists of a Python file containing the relevant model script section and a YAML file defining the inputs, outputs and resources needed to run the Python file (such as the environment). The trained models were saved in a serialised form and used in the scoring stage to make predictions for the next 14 days.
For all of this to run we needed to create an environment, which consisted of a Docker image and a requirements file containing all the libraries and their version information we needed to run the scripts. We also needed a compute cluster that would run the pipeline in Azure. With all these resources defined, we instantiated a pipeline job and registered the pipeline. The outputs of this (which are stored in a Data Lake), were then fed into the Power BI report.
Next steps
We would like to investigate other approaches and toolkits to forecast PM2.5 levels, such as using Deep Learning methods (LSTM) that could also take into account multiple features to make predictions beyond past PM2.5 levels. We are also considering ways to improve the performance of model training through parallelising the workflow using Azure Databricks. It will also be important to fully understand the pricing of building and running this pipeline. This, along with runtime, will need to be compared for Databricks and Machine Learning Studio.

Our recent tech blog posts
Transformation is for everyone. We love sharing our thoughts, approaches, learning and research all gained from the work we do.
-

-
-

Reimagining case management across secure government
Read blog post -