Columns vs Measures is a particularly misunderstood concept in Power BI
The evaluation context is important to note for both of these column creation methods. This is the environment under which the formula is evaluated.
Calculated columns
The evaluation context for the calculated column is performed for each row
Example 1, I need to create an Order Total from Unit Price and Order Qty
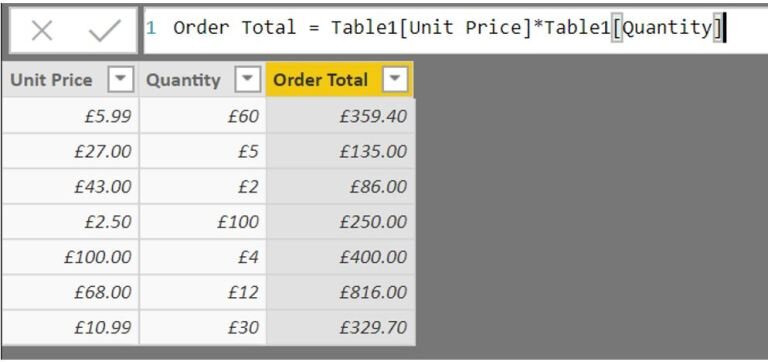
This is correct for the Calculated column as the order total is created for every row.
Misunderstanding the measure and trying to do the same thing as a measure causes issues.
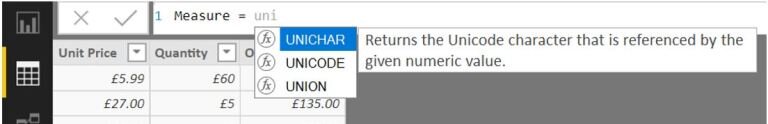
Note that Unit Price not in the list. It is not available to the measure - we will answer why later.
Calculated column data is stored in xVelocity in-memory database. The calculation is made before the model is queried by the user. Calculated columns are good because there is a smaller virtual memory requirement when the user is interacting with the reports. However, they take up more storage in the database.
There are other advantages to the calculated column.
Slicers
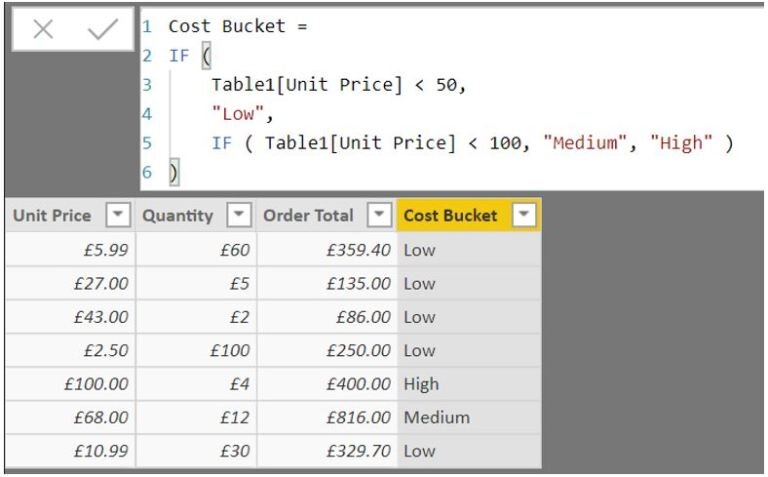
The cost bucket allows us to create a slicer in Power BI based on Low medium or high values. The DAX looks at each row and the new column is set before the model is queried.
Measures
Measures are used to calculate aggregates like Sum or Average.
Measures are created at the time of the query so they are not stored in the database.
Why could we not see Unit Price when we changed the 1st Example to a measure? Because Unit Price is at row level. The measure needs to be applied to aggregated values.
Example 2 – Get the order total of the low value items
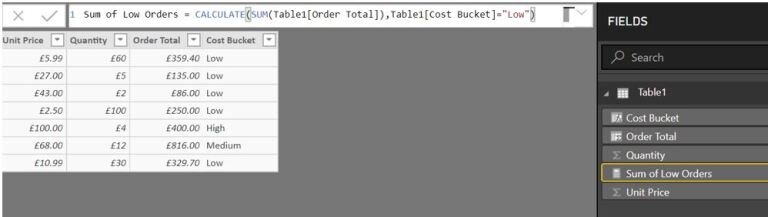
First of all, notice the Sum around Order Total. The Sum aggregates the order total and allows this item to be available to the DAX query.
Cost bucket is available because all Low cost buckets are grouped first in order to find all the Low values.
Next Notice that the Sum of Low orders is not available in the data view pane because it doesn’t exist in the data in the way a calculated column does. We can see the Measure under fields to use within reports.
Measures are evaluated in this specific way:
-
The evaluation context is examined. DAX is selecting Low Priced items
-
The evaluation context is evaluated against the table. Order Total is being filtered on Low Prices
-
The Aggregation is applied SUM
-
Results are returned
What to use when
Calculated columns can be used when each row needs evaluating,
Measures are used for Aggregation.

Our recent tech blog posts
Transformation is for everyone. We love sharing our thoughts, approaches, learning and research all gained from the work we do.
-

-

-

Reimagining case management across secure government
Read blog post -