We'll cover the following:
-
Creating an initial report
-
Setting up bookmarks
-
Choosing buttons
-
Formatting inactive buttons
-
Testing buttons
-
Tidying up reports
-
Toggles overview
-
Adding toggles
-
Connecting toggles
-
Testing bookmarks
When creating Power BI reports, you will be working with multiple pages and may want to include a menu for each page. We can also go further and set up toggles to display your data in different ways; to create Power BI reports that are more user-friendly and interactive.
Cost Of Organised Crime UK 2010 2011.pbix (Example Power BI Desktop File).
horr73-tabs.xlsx (Example File to be used with the Power BI report)Unlike a standard training package that can result in employees being unsure how to implement their new-found knowledge within the organisation, this 5 step quick start leaves you with relevant actionable dashboards for your organisation and the internal skillset to use them. You will have an approach that gets instant feedback and dashboards you can use to build engagement with those using the reports. Building understanding and an arsenal of techniques that can be used to continue building your own momentum and move towards an actionable analytics approach.
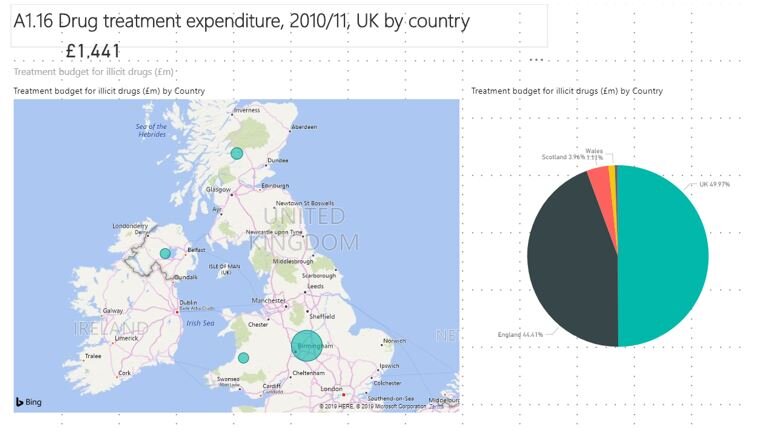
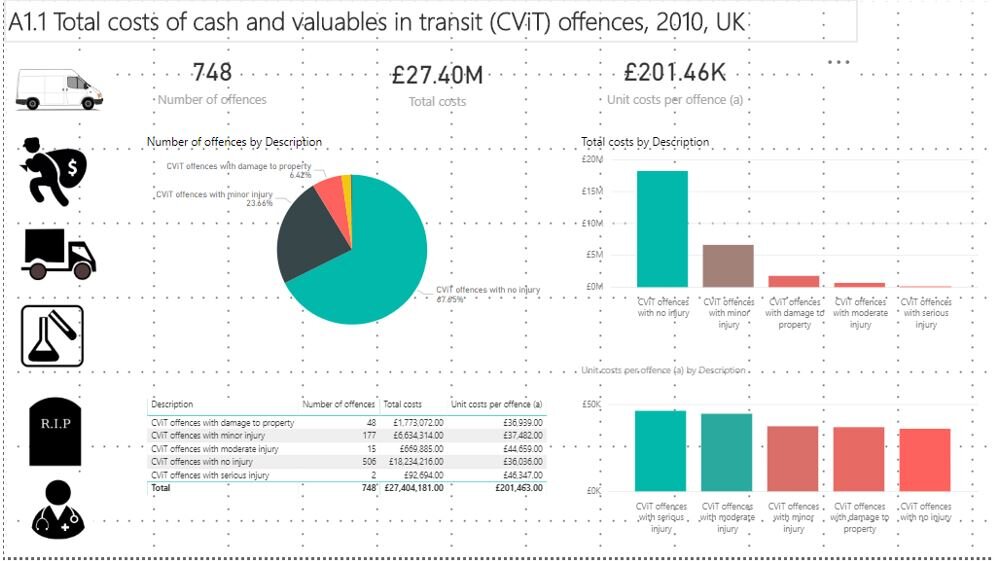
Creating an initial report
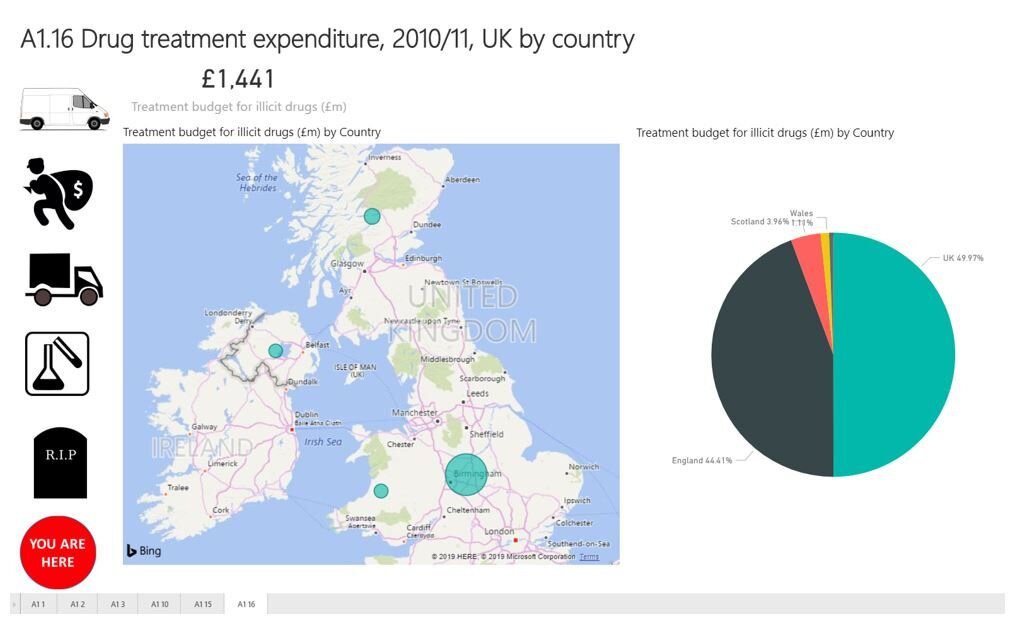
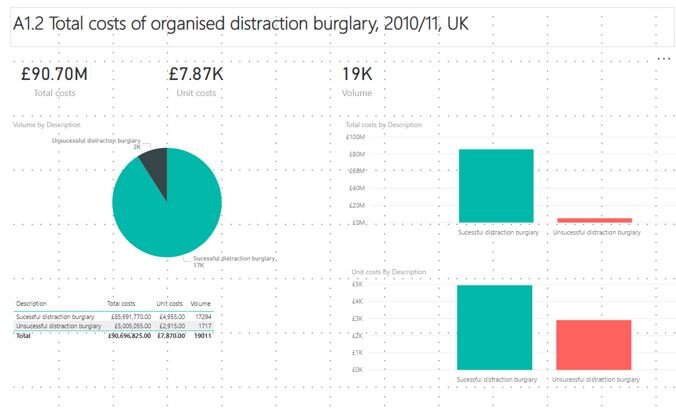
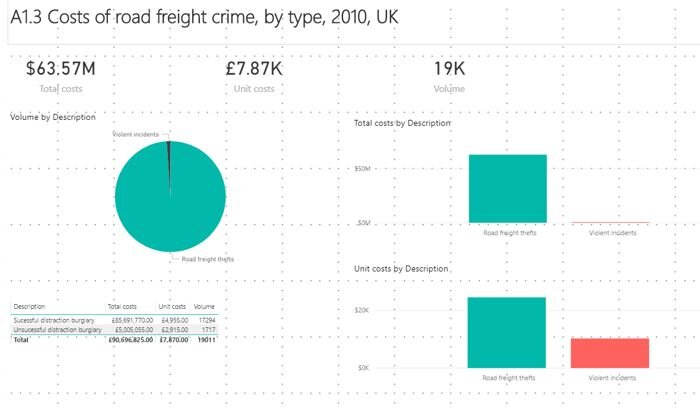
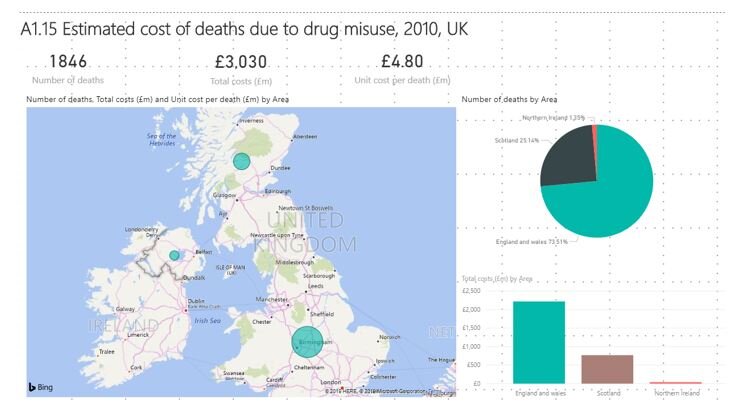
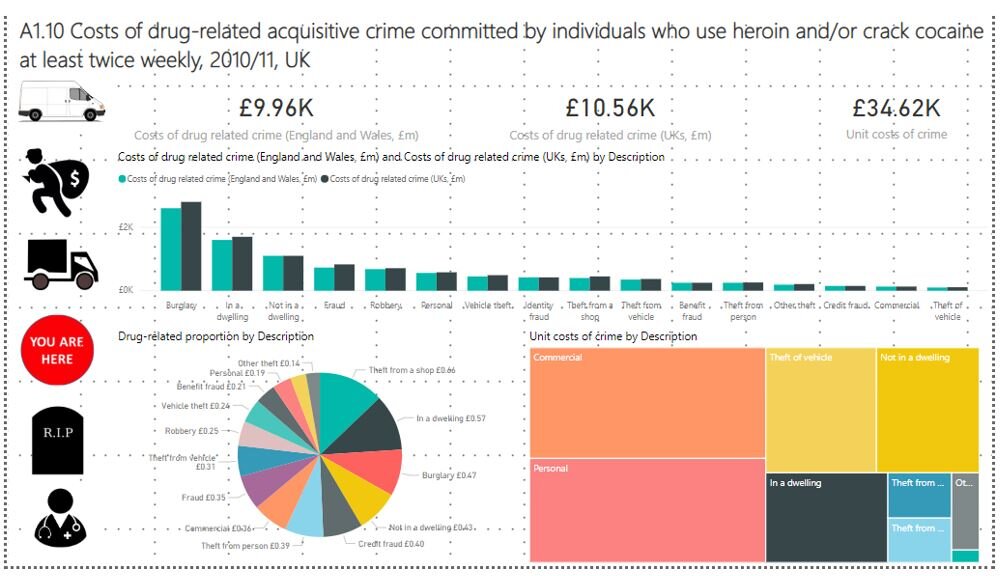
The initial report was created from 2010/2011 UK Crime Statistics and the data was updated to xlsx using Zamzar. The Report contains a few pages of very basic reports; so we can focus on bookmarks, buttons and toggles. Below are the 6 reports:


Setting up bookmarks in Power BI in 3 steps
We want to add buttons on each page, so the user can click quickly between each report. To do this, we need to set up bookmarks for each page; using the following 3 steps:
1. The first page is called A1 1. Go to the page and click on 'View' to select 'Bookmarks Pane'

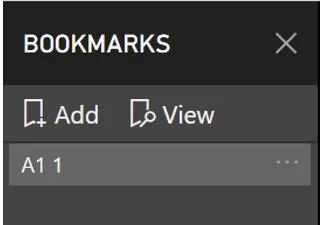
2. With the correct page selected, click 'Add' then call this 'bookmark A1 1'. Because we have created it with the A1 1 page (1st page selected), this is now your bookmark for Page 1.
3. Go to each page an and set up a new bookmark.
Now you can click on each bookmark, note that you are seeing the right report against each bookmark.
Choose your buttons in Power BI in 3 steps
You have a few options here. We can add images or buttons. For this example, we are using images with different borders to denote on or off.
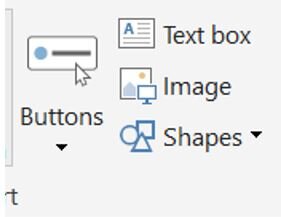
1. For your first page choose a relevant image (Or button and add text).
2. Position your button / image on the page
3. Do this for every page until you have a button for each page on page
4. Once you are happy with the positioning copy and paste each button/image to the exact position on each page. This will mean rearranging your pages slightly to incorporate the menu.
Connect your button to a bookmark in Power BI in 4 steps
Each button needs connecting to a bookmark.
1. For Page 1, we do not need to do anything to the Page 1 icon because the user is on Page 1 so go straight to icon 2.
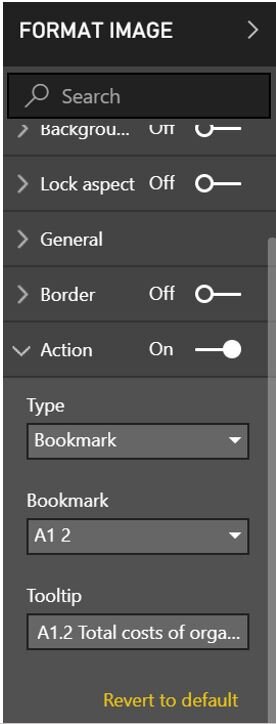
2. In format image, set Action to 1. Connect it to the correct bookmark. (we have also added a tooltip over the image).
3. Repeat for all the other images on page 1 (Apart from the image for page 1)
4. Once completed go to page two and repeat for every image on page 2 (Apart from the image for page 2). At the end of this, all the buttons on every page should be active and connected to the correct bookmark - APART from the button for the page you are on which should be inactive.
Format the inactive button on every page in Power BI in 3 steps
Imagine you are clicking to different pages. How do you know which button is inactive because you are on that page? You need to distinguish the difference between active and inactive buttons.
1. Go back to page 1. We have used an image but there are other ways of doing this if you are using a button or if you want to use another image etc. We are simply going to replace each image with an image to show that you are here.
2. On page 1, delete the inactive Page 1 Logo and replace with the new logo.
3. Do this for every page.
You could also change the background, add a border etc.
Test out your buttons in service
In this example, we are going to use 'My Workspace' in the service to test the buttons.
In 'Home', go to Publish and Publish to My Workspace (Or whichever app workspace you want to publish too).
Let’s go over to Service to test the buttons
Go to your workspace and reports and click on the new report that you have made. Click on each button to make sure it links to the correct page.

Tidying up the reports
You can now get to each report via your buttons. Note that each report also has a tab at the bottom of the screen. You only want the user to click on the buttons. Not the tabs as it may get confusing.
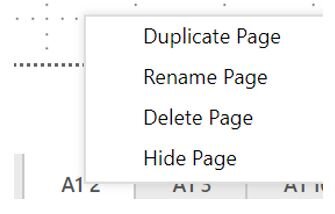
Go back to the desktop. Right-click on Page 2 and choose hide page. Do this for every page apart from page 1.
Page 1 will become our main page so we are going to rename this Main. Republish your report and go back to service. Note that you now can’t see the tabs for the other reports.
How to add and connect up your toggles in Power BI
Your report is looking good but for one of the pages we want to show the data in a different format and we want the user to be able to select the way they look at the data.
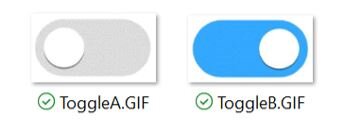
For this, we need images of toggles.
This is slightly more complex than setting up the bookmarks for each button.
Go to the report that you want to change and add a new bookmark. Call it A1 10 Tables.
It's time to open up the selection view:
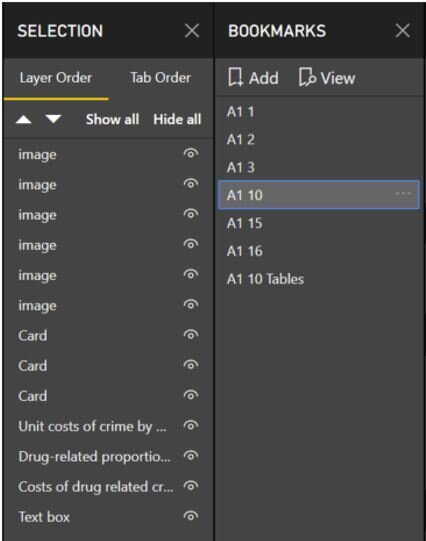
Note that for the original bookmark, the selection shows you everything on this bookmark. You need to go to the new bookmark and hide everything that’s specific to the original page.
Here you can also now change the name of the item in the selection bar so all your images can relate to the image in the report, rather than just displaying card (this was a feature added in a later Power BI Update).
In the 'New Bookmark' click on the icon against the objects on your report to hide.
Note 1: We have hidden 3 objects
Note 2: The current design makes it almost impossible to distinguish hidden from none hidden objects
We are now going to add a table to this new bookmark now we have cleared space:
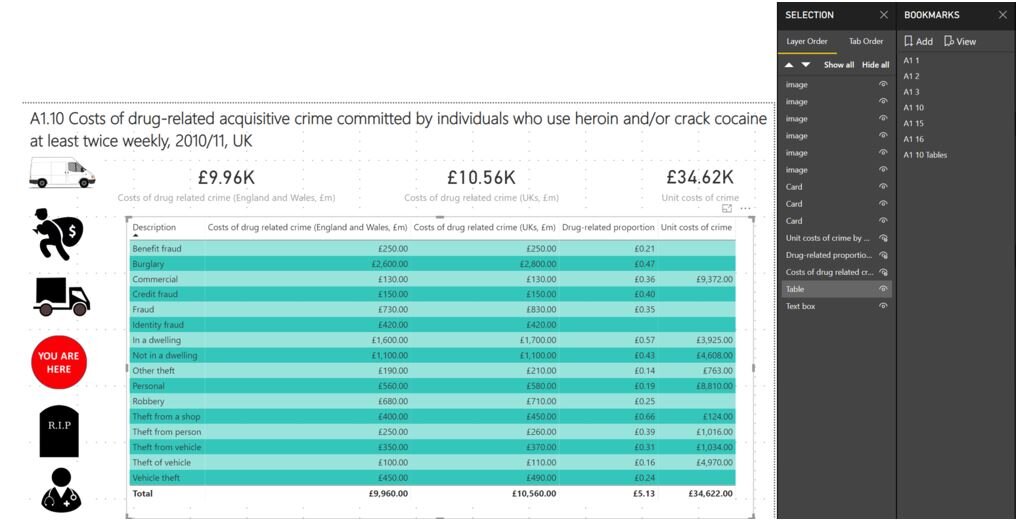
Note that the table is now in the selection.
If you go back to the original bookmark the table will be in here too, overlapping with all your other visualisations. Simply:
-
Select the first bookmark
-
Hide the table
-
Right-click on the first bookmark and update
You can now flip between the two bookmarks to see it move from visualisations to a table.
1. Add your toggles
Finally, we need to add toggles so we can use them to toggle between bookmarks. On bookmark one, we need to add space for the toggle and text.
Now, go to the second bookmark. Notice that you can see the toggle and text. They will need hiding but in the meantime add the second toggle image and make sure it’s the same size as your other toggle. With the first toggle in place, resize the 2nd toggle and then place this toggle over the top of the first toggle. Add your text. Go back to bookmark one and hide the new toggle and text.
Remember to Update the bookmark.
Go back to the new bookmark and hide the 1st toggle and text item. Click through each bookmark so you are happy with what you can see.
Bookmark 1

Bookmark 2

Connect up your toggles
Now its time to connect your toggle. Bookmark 1 needs to go to Bookmark 2 and Bookmark 2 needs to go to Bookmark 1.
In Bookmark 1. Select the 1st toggle. Same as before. Under Format Image, switch action to on. Set to Bookmark and select Bookmark 2.
Repeat for Bookmark 2.
Test Your Bookmarks Go back to the first report. Save and publish your updated report.
Test your toggle.


Our recent tech blog posts
Transformation is for everyone. We love sharing our thoughts, approaches, learning and research all gained from the work we do.
-

-

-

Reimagining case management across secure government
Read blog post -