Our last post explained the rationale behind CSVW. In this post we provide instructions for creating your own.
We’ll work through an example. We’ll annotate a CSV dataset with CSVW metadata to accurately describe its contents.
Let’s start with something simple.
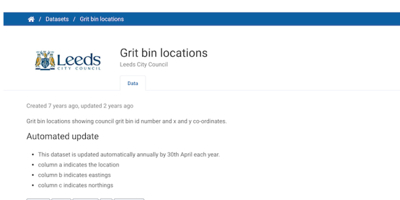
Data Mill North publishes a list of Grit Bins on behalf of Leeds City Council.
The first five lines of the CSV look like this (GitHub Gist).
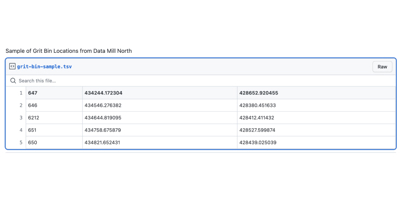
Fortunately the page we got the file from tells us that the columns are:
- location
- easting
- northing
We interpret “location” as an identifier for the spot where the bin is placed — it serves to distinguish the location, not to locate it (i.e. on a map). The second two columns locate these bin-locations with Ordnance Survey National Grid coordinates.
We can use the CSVW standard to make a machine-readable definition of how to interpret the csv.
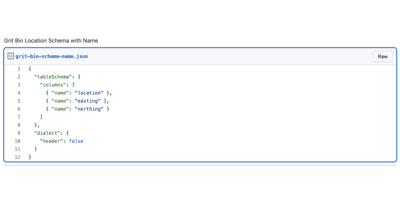
This is done with a JSON file. Here’s how we would give the columns names (GitHub Gist).
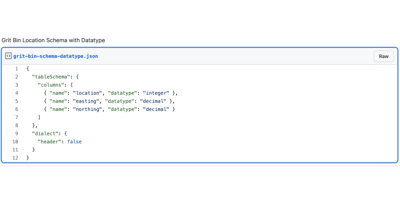
We can then add simple datatypes (GitHub Gist).
We can also explain that the second and third columns are grid references.
We could describe the datatype of these columns as being in metres, which are the units for eastings and northings (and yes the data does seem rather more precise than it needs to be). This wouldn’t be terribly helpful as we’re not really talking about distance per se, but a 2-dimensional distance from the National Grid’s origin point (“0, 0” is somewhere south-west of the Isles of Scilly). Indeed it’s only possible to interpret those distances when you know the origin and the projection used to get from the curved surface of the globe to a flat 2D map.
Fortunately, we don’t need to worry about transforming between coordinate systems or projections. We can just say that we’re using the Ordnance Survey system, by using the identifiers that they provide for this purpose.
We can find those identifiers with the Linked Open Vocabularies search engine. When we search for “easting”, the Ordnance Survey’s Spatial Relations Ontology is the top hit. If we browse to the ontology, we can see that it also has a “northing” property.
We declare them by setting the “propertyUrl” for each column (GitHub Gist).
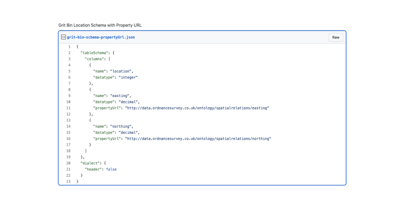
Now applications that know what to do with eastings and northings can interpret the values correctly.
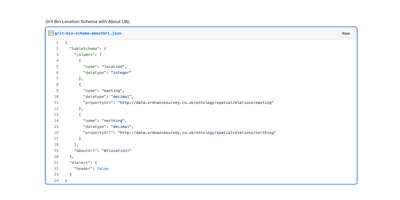
Finally, we can tell the data user that the first column serves as an identifier to distinguish each row.
We can do that by saying that each row is about the location — or what CSVW calls “aboutUrl”. We don’t want to set this on the location column, as it applies to all 3 columns. Instead we set it for the whole table schema. The about-url ought to be specified as a URI template - which lets us describe a URI (Uniform Resource Identifier) in terms of some variables. In our case, the variable comes from the bin-location column (GitHub Gist).
That is basically all the description we really need to provide for the schema.
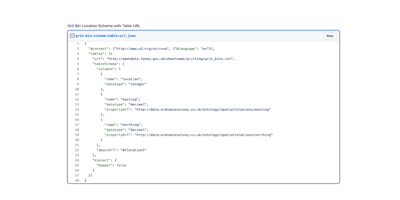
Finally, we need to connect our schema to the original CSV file. We can do this by including the URL of the table. There’s a few other options described in the standard but typically you’ll want to publish the JSON alongside the CSV with the URL pointing from one to the other.
We also need to say that this JSON file is specified in terms of the CSVW standard, we set this using a “@context” key which follows the lead of the JSON-LD standard (a JSON serialisation for linked-data).
Our final metadata annotation for the table looks like this (GitHub Gist):
You may be wondering how you can use this newly annotated table…
Ideally we’d be able to open this up in a mapping tool like QGIS, and have it automatically recognise which columns to use as X and Y coordinates so we could create a map of grit bins.
Sadly we’re not quite at that point yet. This standard is still new and hasn’t been adopted by applications like this yet.
What we do have is a good deal of libraries which implement CSVW in various programming languages.
These can be used to validate the compatibility of CSV and its JSON annotations. This is useful either to check the annotations are correct, or to validate that a given CSV file conforms to a schema.
They can also translate the CSV into either JSON or RDF formats (for example, using this open-source CSV2RDF tool).
For example, this is what a couple of lines of our CSV look like as linked data (GitHub Gist):
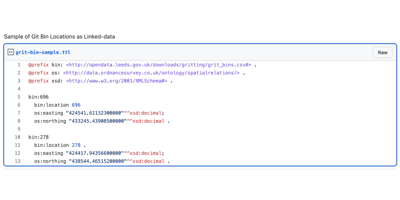
The substantive content is the same, but the extra description earns us the final two open data stars, as promised in the last post:
★★★★ using identifiers to denote things, so that people can talk about your resources unambiguously
★★★★★ linking your data to other data to provide context
We’ve given the bins URIs. Here location 696 gets the URI http://opendata.leeds.gov.uk/downloads/gritting/grit_bins.csv#696. People can talk about this anywhere on the web and know exactly what we’re talking about.
We’ve also adopted URIs from other vocabularies - both the Ordnance Survey’s Spatial Relations Ontology and the venerable XSD Datatypes, linking this CSV file into the web of data. Any tools that know how to deal with Ordnance Survey points or decimal datatypes will know how to interpret this CSV.
This example was nice and simple. It’s almost certain that the data you’re working with is considerably more complex! It mightn’t be immediately obvious how to apply this lesson to your data. Which vocabularies should you use? How should you combine them? How should you structure the table? We’ll provide answers to these questions in our next post in this series, with further examples of how to publish CSVW.

Our recent tech blog posts
Transformation is for everyone. We love sharing our thoughts, approaches, learning and research all gained from the work we do.
-

-

-

Reimagining case management across secure government
Read blog post -