At TPXimpact we help government agencies across the UK publish their data as 5 star open data. That means it’s published under an open licence in standardised, machine readable formats, and conforms to open standards as closely as possible in an attempt to join it to the broader web of linked data.
For these projects, the platform we use is mostly built with Clojure, which has gained popularity over the past decade as a general purpose programming language. It’s not as widely used yet in the data science community, but over the past couple of years several tools and libraries have been developed that make Clojure and its ecosystem an increasingly attractive choice for data scientists.
In this series of tutorials, we’ll learn how to use the PublishMyData platform to download a dataset and then use tools from Clojure’s emerging data science ecosystem to visualise it. In this first post of the series, we’ll download a dataset from PublishMyData and learn how to set up a Clojure programming environment and a new Clerk notebook. Clerk is a computational notebook for Clojure and will serve as the “container” for our data visualisation project. We’ll load our dataset to begin working with it, and then in the next and final post we’ll learn how to visualise the data.
Downloading a dataset from PublishMyData
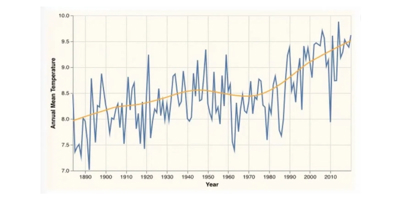
All instances of PublishMyData host, at a minimum, a catalogue of datasets and a way to query them. For this project we’ll start with a dataset on the Integrated Data Service website (which is in beta at time of writing): “Annual mean temp with trends actual”. You can narrow down the list of datasets in the dataset catalogue by publisher or theme to find it (“Met Office” and “Climate Change”, respectively, in this case), or search for it by name.
Our ultimate goal is to make a simple plot showing how the average temperature in the UK has changed over time. From the dataset explorer, we have the option of downloading the entire dataset as tidy data (one observation per row), or we could apply filters and download the resulting subset of data. We are only interested in the data for all of the UK, so we’ll toggle “Filter data” on, then edit the “Geography” filter and select just “UK”, clicking “Apply” to filter the dataset. The filter bank above the data table should look like this:
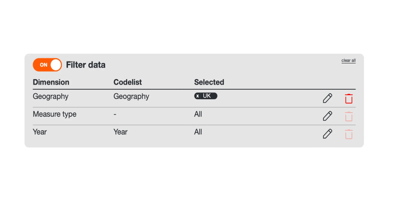
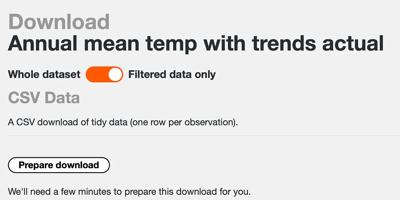
Now we've filtered, we only see rows which are for all of the UK. We can now click the “Download” button, leaving the toggle set to “Filtered data only”, and then click “Download zip” to retrieve the data. If this particular subset of data hasn’t been downloaded in a while, the button might say “Prepare download” instead. If that’s the case just click on it and the download will be prepared after a few seconds.
There should be two files in the downloaded zip: a data.csv file and a README.txt file. We’ll use the data.csv file for our project.
Setting up a Clojure Environment
Running a Clerk notebook locally requires a working Clojure environment. This requires installing both the Clojure programming language itself and an editor that is suited for Clojure development.
Clojure Programming Language
There are instructions on the Clojure website for installing Clojure itself on different operating systems. Clojure requires that Java also be installed. All Java LTS releases (currently Java 8, 11, and 17) are officially supported. Some installation methods will include installation of this dependency as well, others will require that Java be installed separately. See the instructions for your operating system to get Clojure installed on your machine.
Clojure IDE
Clojure developers typically program at a REPL. There are several editors well suited to Clojure development with learning curves of varying steepness. A relatively simple and free option that includes good REPL support is Visual Studio Code with the Calva plugin. If you already use a different editor of course feel free to stick with it and see what kind of Clojure support is available. Most major editors have good support for a Clojure REPL via plugins or packages.
Make a New Notebook
A Clerk notebook is just a Clojure namespace. Clerk interprets the code and comments in the namespace to render them as a web page. To make a new Clojure project with a blank Clerk notebook, we just need to create a new directory for our project and add two files — one to specify our project’s dependencies and another for the notebook itself.
Create a new directory for your project, then add a file called deps.edn and a directory called notebooks containing a single file for our visualisation project. I called mine annual_mean_temp_uk.clj. The name of this file is arbitrary but needs to end with the .clj (for “Clojure”) extension and use underscores to separate words (as opposed to hyphens, spaces, or any other delimiter). I’ve also added the dataset that we downloaded above inside a separate data directory (renamed to annual-mean-temp-uk.csv for clarity). The project structure should look like this:
visualisation-project
├── data
│   └── annual-mean-temp-uk.csv
├── deps.edn
└── notebooks
    └── annual_mean_temp_uk.clj
The notebook file (annual_mean_temp_uk.clj) can remain blank for now. The deps.edn file is where we’ll specify Clerk as a dependency of our project. After updating this file to include Clerk as a dependency, it should look like this:
In deps.edn:
{:deps {io.github.nextjournal/clerk {:mvn/version "0.8.445"}}}
Note version 0.8.445 just happens to be the latest Clerk version at the time of this writing. To be sure the rest of the steps work as described use the same version of Clerk.
Start the Clojure REPL
Open this project directory in your editor of choice, and start a REPL. How you do that will depend on which Clojure IDE you’ve chosen to work with. If you’re using Visual Studio Code as described above, you’ll start a REPL by selecting the command palette option “Calva: Start a Project REPL and Connect (aka Jack-In)”. You can bring up the command palette in Visual Studio Code with ctrl+shift+P (or cmd+shift+P on a mac), then search for this command. If you’re asked to select a project type, choose deps.edn.
This should download the Clerk dependency we specified in our deps.edn file and start a REPL.
You might see several new hidden files appear in your project directory. These are called “dotfiles” (because they start with a dot), and are used by the editor and Clerk to track project state. They can be ignored for development purposes.
Set up a Clerk notebook
So far we have a deps.edn file with a single dependency (Clerk) specified in it, an empty visualisation namespace, and a REPL running and connected to this project. Next we’ll learn how to actually run a Clerk notebook.
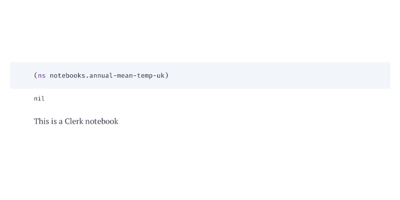
As mentioned earlier, a Clerk notebook is just a Clojure namespace. To see what this means, try adding a basic namespace declaration and comment to the annual_mean_temp_uk.clj file:
In notebooks/annual_mean_temp_uk.clj:
(ns notebooks.annual-mean-temp-uk)
;; This is a Clerk notebook
Note the conventions for Clojure namespaces — the namespace name matches the name of the file, with the extension removed; underscores are converted to hyphens, and directory separators are converted to periods. These details are important so that the namespaces can be loaded properly. It’s also good practice for namespaces to include at least 2 segments, to avoid name collisions and potential problems with Java interop.
Now try starting the Clerk notebook. First enter this into the running REPL to require Clerk:
Evaluate in the running REPL:
(require '[nextjournal.clerk :as clerk])Then start a local Clerk server and tell it to show your new notebook:
Evaluate in the running REPL:
(clerk/serve! {:watch-paths ["."] :browse? true})
(clerk/show! "notebooks/annual_mean_temp_uk.clj")
We’ve given two arguments to Clerk’s built-in server. The first is to instruct it to watch the root of our project for changes so that the page automatically reloads whenever changes are saved (watch-paths). The second is to tell clerk to open a new browser window for our notebook (browse).
You should see something that looks like this in your browser, assuming you copied the same placeholder text from above:
Loading data into the Notebook
Clerk comes with several built-in viewers for data. In the next post in this series we’ll learn how to use the vega viewer to build visualisations. For now we can quickly inspect our data using Clerk’s built-in table viewer, which is where we’ll leave this tutorial for now.
To read our CSV file, we can use Clojure’s standard CSV library. We need to include it as a dependency, so our deps.edn file will look like this now:
In deps.edn:
{:deps {io.github.nextjournal/clerk {:mvn/version "0.8.445"}
        org.clojure/data.csv {:mvn/version "1.0.1"}}}
To download the newly added library, restart the REPL.
We’ll require this CSV library in our namespace and use it to parse the contents of our file into a Clojure data structure. Then we can use Clerk’s built-in table viewer to render our data as a simple table. All that should result in an annual-mean-temp-uk namespace that looks like this:
(ns notebooks.annual-mean-temp-uk
 (:require [clojure.data.csv :as csv]
           [nextjournal.clerk :as clerk]))

(-> "data/annual-mean-temp-uk.csv" ;; name of the file
    slurp              ;; read the contents of the file
    csv/read-csv       ;; parse the result as csv data
    clerk/use-headers  ;; tell Clerk to use the first row as headers
    clerk/table)       ;; render the data as a table
The notebook should refresh automatically when the file is saved, showing the table.
Conclusion
We have a working Clojure environment running locally and know how to set up and display a new Clerk notebook, using some of its most basic functionality to begin to explore our data. We’ve only covered the bare minimum about Clojure required to make this notebook load, so if it’s new to you and of further interest there are dozens of high quality, free resources available for you to dig deeper. The source code for this demo is also available on github (the code up to this point is on the main branch) for comparison.
One of the best parts of working with data in Clojure is the welcoming and helpful community, so if there are any issues you can usually find help on the Clojurian’s slack or Clojureverse forum, or of course feel free to ping me in any of the many places I lurk around the internet!
In the next and final post of this series we’ll learn how to build data visualisations with Clerk’s vega viewer and Hanami; a library for writing succinct vega and vega-lite specifications in Clojure.

Our recent blog posts
Transformation is for everyone. We love sharing our thoughts, approaches, learning and research all gained from the work we do.

Data discovery in action: Why lessons from social housing matter for all departments
A closer look at how data flows through real-world services, and what social housing can teach us about making it usable, connected, and meaningful.
Read more
Spec-driven development: Why AI still needs engineering discipline
AI follows precedent, not just intent. If your foundations are vague, automation only accelerates entropy. Discover why the shift from building to orchestrating requires more engineering rigour than ever before.
Read more