As part of work being done to build a shared understanding of services within Defra Group, we recently faced a significant challenge: how to make a complex service landscape both accessible and meaningful.
Our approach moved beyond a traditional service blueprint to create an ecosystem map that shows the full landscape at a glance. We were deliberate in taking a more creative illustrative approach to this.

The result has led to many people telling us how much they love this map. In this post, I’ll share more about how and why we approached creating the visualisation in this way, and how this is intended to support Defra teams.
Our approach to visualising a service eco-system
This map was the result of partnering with the transformation team at Defra to understand and define whole service areas. So efforts to streamline delivery, improve user experience and track outcomes are based on a full picture of what Defra services are and how they connect from the users' perspective.
A whole service area is a group of services that meet common user needs and help Defra achieve common environmental outcomes.
The visualisation needed to communicate the scale and interconnectedness of Defra's services while remaining clear for executive-level discussions.
The primary audience for the map is senior leaders, who don't need to drill down into all the operational details, but who do need the basis on which to make decisions around organisational strategy. We aimed to create an intuitive visual narrative that highlights:
-
complete whole service areas with their associated sub-services
-
the organisations involved in delivering the services in each whole service area
-
the different user types who engage with the services in each service area
-
visual illustrations of select sub-services to bring them to life
Rather than showing single-user journeys, we focused on mapping whole service areas and how they connect and overlap, giving viewers a comprehensive understanding of Defra's complex ecosystem.
Based on research with Defra colleagues who work closely with senior executives to understand what was likely to be successful in that context, we applied specific design principles to ensure the visualisation would resonate with senior leadership. We focused on creating immediate clarity, placing all essential information within the visual itself, establishing clear visual hierarchies and thoughtfully organising elements like the sub-services list.
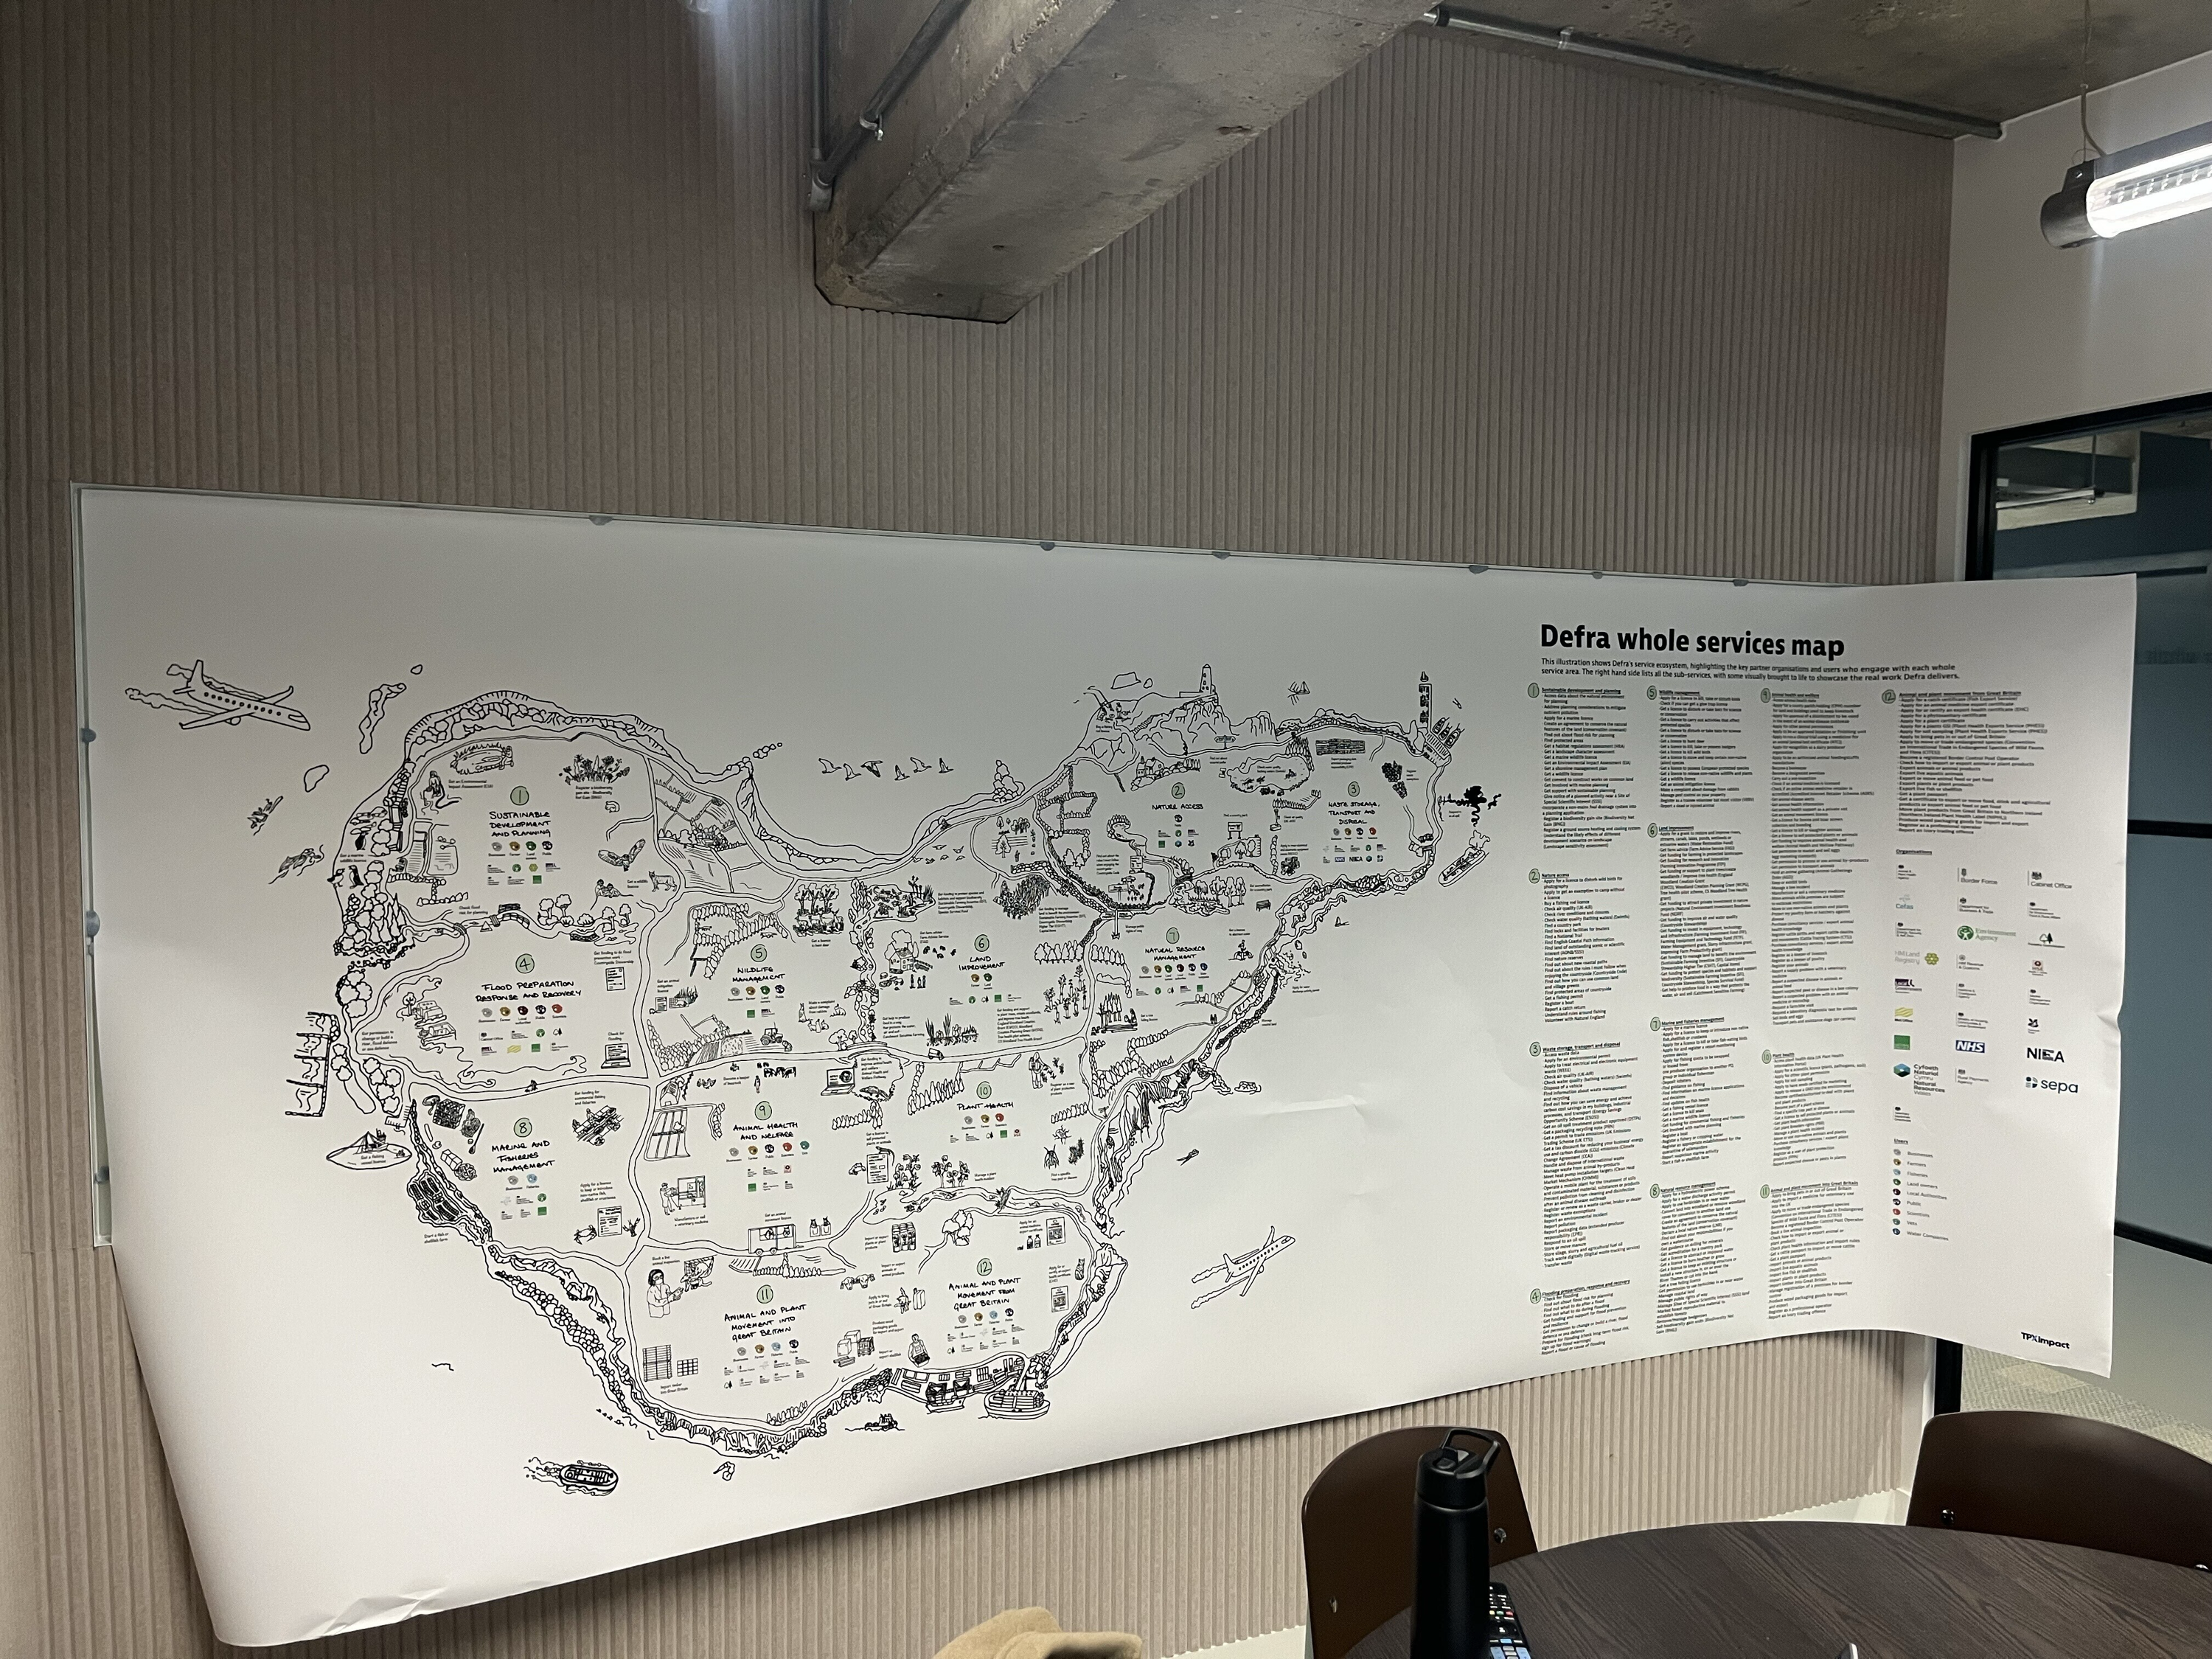
The final visualisation presents whole service areas as interconnected regions, each containing sub-services that help users achieve specific goals.
By zooming out to see the bigger picture, we've created an illustration that helps make sense of a complex world from different perspectives, while allowing viewers to zoom in and see the people affected by these services.
We chose this approach because traditional service design diagrams like service blueprints or lists weren't effectively communicating the scale and interconnectedness of Defra's services.
The ecosystem mapping approach allows viewers to see patterns and relationships that might otherwise remain hidden, like revealing that the services in any given whole service area are currently run by different Defra group organisations, each of which has its own separate guidance information or online service, that isn’t always joined up with information from the other organisations. Seeing the bigger picture in this way supports Defra's goals of streamlining services and making best use of shared resources, technology and data.
How this visualisation will be used
This visualisation provides Defra teams and executive committee with an immediate view of their whole service ecosystem and serves as a foundation for transformation discussions.
Importantly, it’s designed to act as a conversation starter rather than a finished product. It's designed to draw people in differently than traditional diagrams or maps, helping the information sit in people's minds for longer.
The intent is that it will continue to be used in workshops and strategic discussions about how Defra works as a service organisation. It makes the complex visible and tangible, showing how different service areas relate to each other and where they connect.
In order to present this work to Defra stakeholders in an impactful way, we chose a physical, large-format print (approximately four metres long).
We know from testing that it can be difficult for people to process the amount of information involved in the whole services ecosystem on a screen. A physical print gives viewers time to digest information better, enabling people to stop and come back to different parts. As viewers acclimatise to the visual, patterns begin to pop out, revealing what sits across specific boundaries.
Making complex information about services accessible
Working with Defra's accessibility team was crucial to ensuring the design was as inclusive as possible. We carefully considered text size, font choice and contrast, reduced cognitive load by making icons as clear as possible and having a repeated format to show user groups. We created a separate printed key that can be referenced independently to avoid someone with any mobility issues having to move back and forth from the map to the key.
For those who cannot use the visual format, we created a comprehensive text description that captures the essential information. This alternative format helps users locate specific sub-services on the map, understand relationships between neighbouring whole service areas, and identify key elements within each service region.
We carefully balanced describing the illustrations with conveying the meaningful information, ensuring the text version stands alone as a valuable reference while providing equivalent access to the insights contained in the visual representation.
This ecosystem map doesn't just show what exists today; it provides a foundation for reimagining how Defra's services could be organised tomorrow, with common user needs and shared environmental outcomes at the centre. It’s also an important example of how a more creative approach to visualising complex information can improve clarity and support strategic work within organisations.
More from our design blog
Transformation is for everyone. We love sharing our thoughts, approaches, learning and research all gained from the work we do.
-
-

What good design documentation looks like
Read blog post -

-
Naming services in complex situations
Read blog post