
A fact of enterprise software engineering is that most projects are quite similar in their implementation. Businesses of course vary hugely, but to an engineer, all those differences will always be reduced to blocks of data and rules.
The average enterprise project will involve tracking and managing some sort of data, be it people, stock, time or customers. It might not seem that the software tracking the inventory at a supermarket has much in common with, for example, financial software at a bank, but once it is reduced to code, there is often little difference between the two.
This is not to say that enterprise development is simple, however. The complexity comes from correctly understanding how a business works, and producing something that meets a real user need. By far the most complex part of enterprise software engineering is the act of producing useful automation for someone who knows how to perform their job, but not how to describe it.
Human jobs are often a mess of edge cases, common sense judgement or lateral thinking. None of these can naturally be translated into code.
Dealing with the technically complex in the utilities sector
Every now and then, you get a project that is heavily skewed the other way: simple requirements, but technically complex.
So it is with a recent project one of our teams has been working on for Wales & West Utilities, creating a mapping tool for the laying down of gas pipes. It's a simple enough concept — connect point A to point B — but the underlying technology is highly challenging.
Technical complexity such as this is often quite hard to explain, although here’s an XKCD cartoon which sums it up succinctly — although of course, this predates modern ML tools which make light work of image recognition.
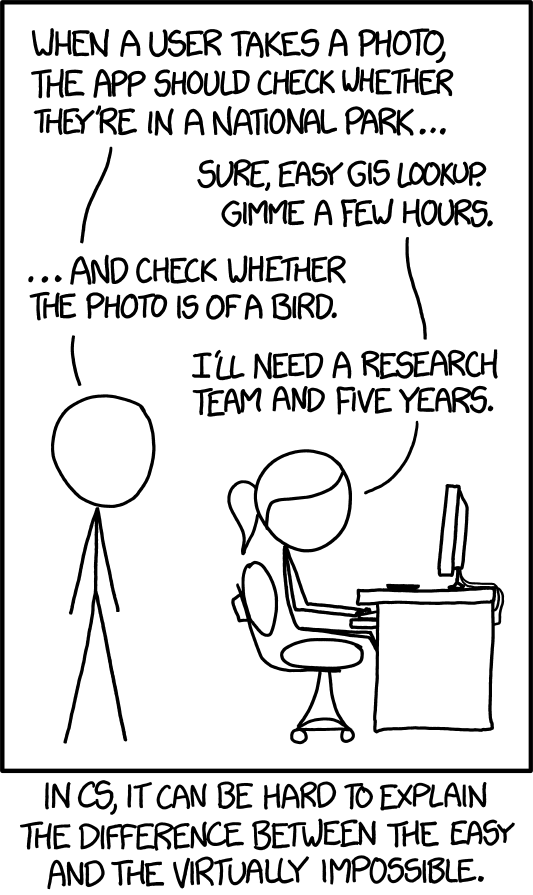
Building a Geographic Information System (GIS)
To start with, what is GIS? Standing for ‘Geographic Information System’, it means data that has a geographical component. Think of Google maps, and the ability to find, say, ice cream parlours within one mile of your house.
You have a standard bit of data, e.g. a shop that mentions ice cream in its description, and a geographical element, such as a lat long coordinate. This geographical element could be anything in theory, such as a shape that defines the delivery area.
For this project, the requirement was to replace an existing system that enabled a customer to calculate and estimate the cost of connecting gas to their property.
Of course, a pipe cannot go through buildings, or a river, and must also stay a reasonable distance away from these obstacles for structural reasons. From the perspective of Wales & West Utilities, the tens of thousands of these requests that they receive in a month would create enough work to occupy an entire team if done manually (staff who would also then need to be trained in how to use expensive and complex GIS software) so the need to have a fully automated solution is paramount.
On the surface, this seems a simple requirement, as this is exactly the kind of task that a human brain is perfectly suited for, being a massively parallel supercomputer. A regular computer, on the other hand, is not.
To empathise with the computer’s predicament, imagine being blindfolded in a maze, and taking single steps at a time. You can tell when you bump into a wall and can retrace your steps perfectly. How would you find the shortest path out of the maze short of trial and error?
Solving the shortest path problem
This category of computer science is called ‘shortest path’, and it is a graph problem, where a ‘graph’ means a collection of nodes and edges. You use an ‘edge’ to move from one node to another, sort of like a chess board. The algorithms in question owe their creation to Edsger Dijkstra, a brilliant mathematician from the very early days of computing, and the algorithm is often called ‘Djikstra’s algorithm’.
To give an idea of the scale of the challenge, you are trying to calculate the shortest path across a 100 metre square area in 20 centimeter ‘steps’. To visualise it, imagine dropping a grain of rice every 20 centimetres in a 100 metre square area. This is now 250,000, or a quarter of a million grains of rice (nodes) and 8 edges for every grain of rice, so 2 million edges.
The program can move from rice grain to rice grain to calculate a route, and needs to do it in the kind of time frame you would expect a website to respond, so a maximum of 1-5 seconds at the uppermost limits of human patience. The program also needs to be reliable enough to handle every orientation and shape of the building, and every edge case where, for example, a river and a railway prevent a direct route to the pipe.
This is, of course, easier to understand with images:
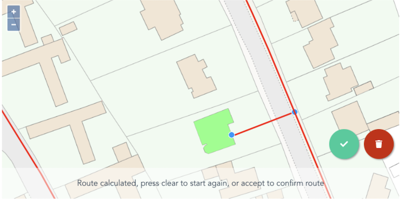
Image 1: A trivial connection between a property and a gas main.
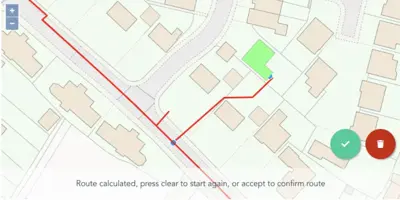
Image 2: A connection between a building and the gas main, threading a path between obstructing buildings, following the shortest path.
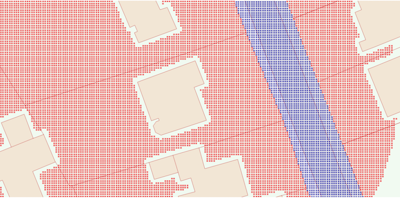
Image 3: What the computer really ‘sees’
How do we ensure we build the right technical solution?
The nature of this kind of work is that discovery and requirements become even more important to get right the first time with the client.
This can sometimes seem frustrating to an organisation, partly as there is a sense of being asked to repeat yourself, and partly because the exercise of describing something that seems simple in excruciating detail, is quite tiring.
The problem is that chances are, the people who are involved in the business process have a lot of knowledge that is taken for granted, and we need to uncover it. The common challenge of technical project management is finding a format of conversation that extracts this knowledge without ambiguity, without it feeling like twenty questions.
When it comes to algorithmic projects, the increased cost of rework or misunderstanding is extremely high. It is bad enough for a regular data entry project to misunderstand, for example, that emails were supposed to be sent to the customer, but projects involving already complex algorithms suffer much more if they need to be constantly revisited.
Debugging a faulty path is also a unique challenge, as it is hard to step through code a quarter of a million times in order to determine why a particular route was drawn. In effect, it is similar to the effort of trying to imagine a statistical graph by looking at each individual data point in turn. There is no shortcut for this challenge, other than accepting that this form of development is slower than usual and that every hour spent ensuring the requirements are accurate is worth ten hours of development time.
Putting in the groundwork
When it comes to getting business sign off for algorithmic work, I’ve found presenting things visually, through flow charts and diagrams, to be the only reliable way to ensure requirements are accurate. This is, of course, extra challenging in the era of Covid and remote work, as there is nothing digital that achieves the clear communication of ideas achieved by a group of people around a whiteboard.
As challenging as this might be, and as much as an organisation might want to crack on and build a solution, you just have to put the groundwork in at the beginning to get things right. In the case of Wales & West Utilities, this has resulted in a technically advanced solution that is vital to their day to day operations. It's a great example that when technology works well, it makes everything else much more simple.

Helping Wales & West Utilities bring energy to people's homes
How we helped Wales & West Utilities to work out where to lay gas pipes quickly and efficiently, by building their own bespoke software.
Read more